From Sample to Story: A Guide to Navigating the Nuances of Survey Research in the Jewish Community
by Laurence Kotler-Berkowitz
Surveys are seemingly everywhere in the Jewish community. Utilized for a wide range of purposes—to evaluate programs, plan for community services, identify people’s needs and preferences, and so much more—surveys fuel much of what we know about Jews and their lives today.
But surveys are not all the same in their design and implementation, in particular how they build the sample of respondents that are analyzed. As a result, what and how we can report about their findings are not the same either.
It’s important not to conflate characteristics of one kind of survey with those of another. For example, the term “statistical significance,” which many readers will be familiar with, has a very specific definition in the field of statistics. This term is relevant to only one kind of survey—those with random samples from much larger populations. It should not be used with other kinds of surveys that use different sampling methods, but it often erroneously is.
The Jewish community is getting better about how it describes samples and reports survey results, and Rosov Consulting is committed to being part of that improvement. We recently conducted a community-wide survey for the Jewish Federation of Northern New Jersey. In the survey report that we partnered with the Federation in writing, the term statistical significance appears on only one page—to explain why we were not using it on the rest of the report’s pages. The reason: the survey was based on a sample gathered by nonrandom methods, and using statistical significance to describe the results would have been misleading.
Improving how and what we report about surveys, while methodologically the right thing to do, may nonetheless create challenges. Misperceptions about the nature of different kinds of surveys will need to be addressed, and correct expectations will need to established. At the end of the day, though, having a better understanding of surveys—and the ways in which we should report their findings—will ultimately benefit us all.
Three kinds of sampling
One of the most important distinctions among surveys is the type of sampling they use. Three basic types exist: probability, nonprobability, and census. Understanding their differences is critical.
When they think about surveys, what a lot of people have in mind—implicitly if not in the technical details—is probability sampling. At its core, probability sampling involves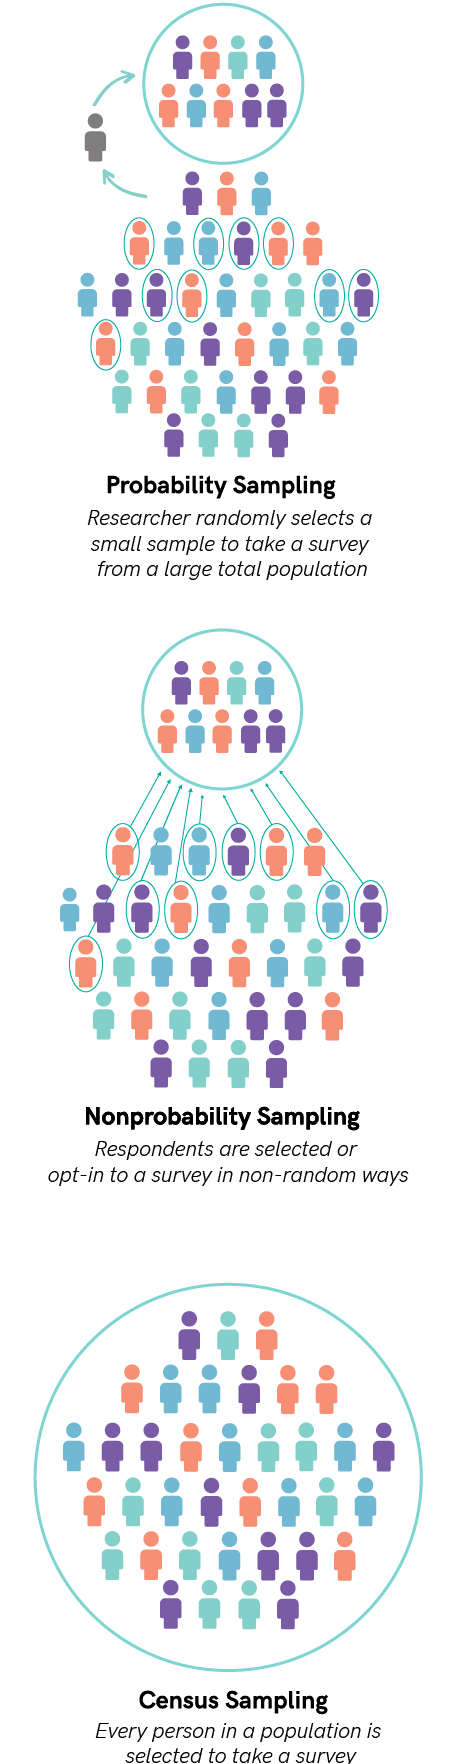 a researcher selecting a random sample from a much larger population and administering a survey to those randomly selected respondents. There are variations on how the random selection of respondents is conducted, and there are other technical specifications as well, but random selection of a sample from a large population is the key to probability sampling.
What are some examples of surveys that use probability sampling? Political polls conducted by top media organizations like The New York Times and The Washington Post are probably the best known. Surveys conducted by the Pew Research Center—including their two surveys of US Jews in 2013 and 2020—are another example. A third is the US government’s Current Population Survey, which produces important economic statistics like the country’s unemployment rate that is reported on the first Friday of every month.
Probability sampling has two great advantages. First, the random nature of selection in probability sampling allows us to infer from the sample to the population from which it is drawn. Second, we can learn about very large populations with very small samples. Think about political polls. A randomly selected sample of 1,500 respondents can accurately represent 300 million people, whereas regularly surveying 300 million people is simply not feasible. At the same time, surveys that use probability sampling are the most methodologically difficult to implement and, therefore, the most expensive. This limits their use in the Jewish community to selective national and local community studies commissioned by organizations that can afford them.
The other kinds of sampling stand in contrast to probability sampling. In nonprobability sampling, respondents are selected for a survey—or, more often than not, choose to opt-in to a survey—in non-random ways. As with probability sampling, there are some additional technical details around nonprobability sampling, but what defines it is the non-random selection of respondents. Many of the online survey panels that companies have established by recruiting people to take surveys, usually in return for some form of compensation, are based on nonprobability sampling. So, too, are surveys that are distributed by posting a link to them on organizational or social media sites.
Nonprobability sampling is typically preferred when a large target population is hard to define or find, when budgets cannot support the much higher costs of probability sampling, or when a survey needs to be fielded quickly. The major drawback to nonprobability sampling is that the nonrandom selection of respondents eliminates the statistical basis for inferring from the sample to a larger population. In statistical theory, a nonprobability sample speaks for itself alone.
In census sampling, every person in a population is selected to take a survey. Surveys that are distributed to all program participants, organizational members, or conference attendees as part of an evaluation process are examples of census sampling. It is rare for a survey using census sampling to receive responses from everyone who is invited to take part, but this does not change its status as a census-based sample. From a sampling perspective, what is important is how and how many respondents are selected.
A census approach to sampling often makes sense when the total population under study is closed (or bounded), when it is relatively small, when there is contact
information available for all (or nearly all) population members, and/or when giving all population members a chance to voice their opinion is important. The ability to infer from a census-based sample to the total population that received a survey invitation is not as definitive as in probability sampling, nor as undetermined as in nonprobability sampling.
Three kinds of errors
There is no perfect survey. All surveys have errors, which are sometimes called biases, that are due to the very nature of survey taking. This includes sampling: each of the three sampling methods is associated with particular kinds of survey errors and/or biases.
The great advantages of probability sampling are tempered by what we call sampling error. (Granted, it would be nice if it were called probability sampling error, or random sampling error, but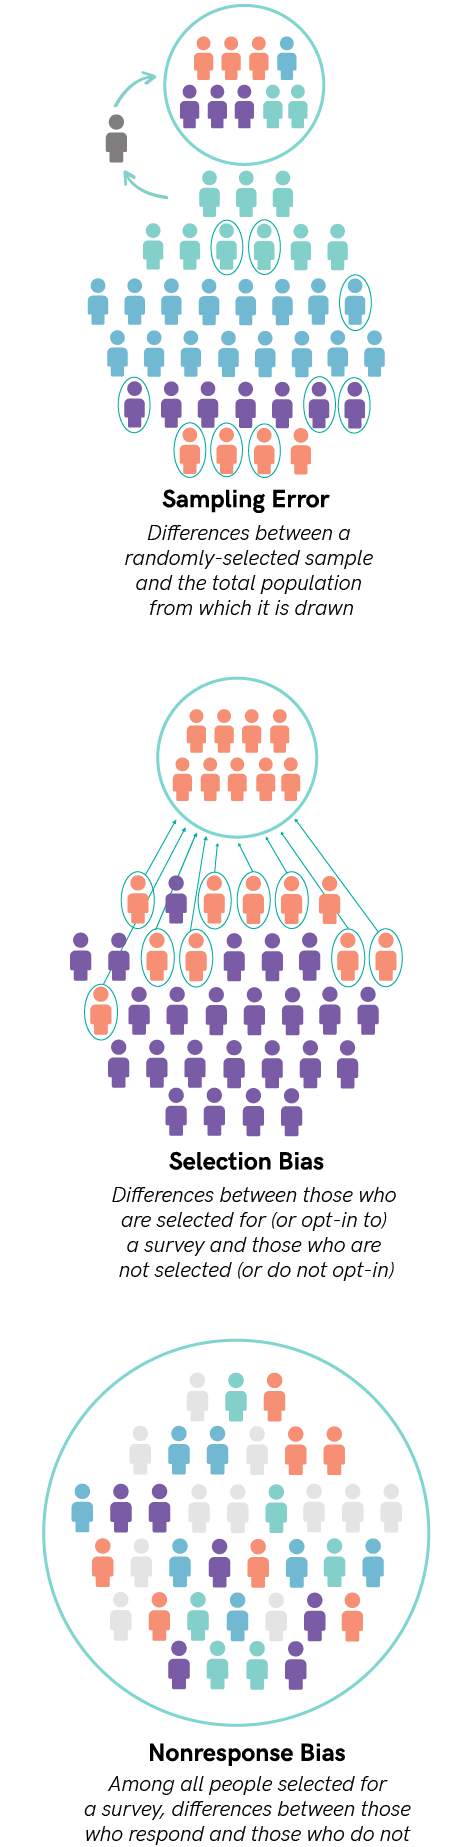 it’s not. It’s just called sampling error.) Sampling error is the potential error in survey results that is produced precisely because a random sample of a population, rather than the entire population itself, is surveyed.
There are many elements of sampling error. One has already been mentioned: statistical significance. Another is the margin of error, which many people will also have heard of. More technical components include confidence intervals, confidence levels, and p-values. Together, these elements provide us with guidance on whether the results from a random sample are also likely to exist in the population from which the random sample was drawn, and if so, the likely range of the true results i n the population. Probability sampling and sampling error are two sides of the same coin. We can’t have one without the other.
In nonprobability and census sampling, researchers do not select a random sample of respondents from a larger population. As a result, neither of them has sampling error, and the components of sampling error—margins of error, statistical significance, confidence intervals, confidence levels, p-values—are not applicable to them.
Instead, surveys that use nonprobability sampling are especially prone to selection bias, which occurs when there are differences between those who are selected to take a survey and those who are not, or those who select themselves to take a survey and those who do not. Sometimes, but not always, selection bias in nonprobability surveys can be addressed and partially reduced by weighting a nonprobability survey to valid external data on key respondent characteristics.
Surveys that use census sampling, in turn, are particularly susceptible to nonresponse bias. Nonresponse bias occurs when, after being selected for a survey, the people who respond are different from the people who do not. Driving response rates up can help mitigate nonresponse bias–the more people in a closed population that respond, the less we have to worry about those who don’t respond being different. The closed population and ability to calculate response rates in census sampling is one of the advantages of census sampling over nonprobability sampling. Weighting a census-based sample to the entire sample frame (that is, to all the people who were sent the survey) on key respondent characteristics can also help reduce nonresponse bias.
Nonprobability and census-based samples that are weighted to address selection and nonresponse bias are better than their unweighted counterparts. Ultimately, though, survey weights don’t change the fact that sampling error is inapplicable to both nonprobability and census sampling.
The misreporting of sampling error
Importantly, there is asymmetry regarding which errors are associated with which sampling methods. Selection and nonresponse bias, which are especially likely to affect nonprobability and census sampling, can also bedevil probability sampling. But sampling error is, by definition, limited to probability sampling. Nonetheless, reports of surveys that use nonprobability and census sampling sometimes include components of sampling error. Why does this happen?
There appear to be four reasons. The first is simple, honest misunderstanding. Most researchers—not to mention just about anyone who ever took a Statistics 101 class—learned about sampling error based on the correct conditions of probability sampling, but they were seldom told that it doesn’t apply in other sampling situations. Second, reporting sampling error is a classic vicious cycle; the more it is reported, even mistakenly so, the more people expect it to be reported.
Another reason is that the various components of sampling error can, in fact, be calculated from all surveys, regardless of their sampling procedures. Most statistical software assumes it is processing data from probability samples and automatically generates significance tests and other components of sampling error. It falls to researchers to know when to appropriately report sampling error—and when not to.
Lastly, neither selection bias nor nonresponse bias have a set of components that let us describe and measure them the way we can with sampling error. Lacking summary measures, they don’t get as much attention as sampling error. But they are just as important as sampling error, if not more so, and we need to make our sector more aware of them.
How to talk about surveys with different sampling strategies
With the language of sampling error not available for surveys that use nonprobability and census sampling, how do we talk about their findings?
On the quantitative side of things, we should put more emphasis on effect sizes, which are descriptive measures that tell us about the strength of relationships in survey data but do not depend on the sampling method. Some of these are conventional statistics—for example, correlations, regression coefficients, and odds ratios—that we don’t tend to think of as effect sizes, even though they really are. Other effect sizes are more specialized—statistics like Cohen’s d, Cohen’s h, and Cliff’s delta (𝛿). In both cases, effect sizes are relevant for understanding results from surveys that use all kinds of sampling —probability, nonprobability, and census.
While we do not have the measurable components of sampling error to guide us in assessing findings from nonprobability and census-based samples, we do have other important information about them. Response rates (where calculable), survey weights to address bias, question wording and question order, consistency with prior research findings, and grounding in theory can all inform our judgments about various types of validity that attach to studies based on surveys. In other words, what we need to do is apply more qualitative assessments to the study design and implementation of nonprobability and census samples (as well as probability samples).
For probability surveys, we can and should continue to examine sampling error. But evaluations of probability samples should not begin and end with statistical significance and other components of sampling error. Effect sizes are also important; it is not uncommon that findings from probability samples, especially very large samples, can be both statistically significant in the conventional sense and have small effect sizes. This combination means that a small or weak relationship found between two variables in a survey sample is also likely to exist in the larger population—but still as a small or weak relationship.
In addition, the conventional criteria for declaring statistical significance has come under increasing criticism for being both arbitrary and too strictly enforced in the social sciences, leading us to miss important findings. The components of sampling error, chief among them statistical significance, should guide us, not handcuff us. A little flexibility when considering statistical significance will go a long way.
Reporting about different surveys based on their sampling methods, the types of survey errors and biases that affect them, and how we can assess their validity, will likely have its challenges. Transparency about our efforts is critical to resetting understandings and expectations. We are committed to doing this, because it will make all of us better data producers and data consumers. And, we hope, it will help elevate the conversation about surveys across the Jewish communal sector.